
COVID-19 is evolving, so data surrounding it evolves, too. Naturally, we have more questions than answers.
Thankfully, we have experts from across disciplines pitching in to adapt to the changing tide, and help explain the data.
Civil Beat enlisted two of them — a data expert and an epidemiologist — to talk about what data is out there, what statistics are relevant and useful, and how this information can be used in decision-making, in a web event on July 30.
Nick Redding is executive director of the Hawaii Data Collaborative. Thomas Lee is an assistant professor of epidemiology at the University of Hawaii Manoa. Lee is also a modeler for the Hawaii Pandemic Applied Modeling Work Group, or HiPAM.
Watch the event in full here:
Hawaii lacks robust public data about the virus and related metrics, a recent report by a national public health organization showed. The state’s public dashboard doesn’t show much beyond very basic information.

Nick Redding, executive director of Hawaii Data Collaborative, says COVID-19 has mobilized experts across disciplines to come together.
Nick Redding
Local data is critical in responding to the unique challenges of Hawaii, Redding said.
“Systematically, here in Hawaii, there was a challenge around understanding the unique considerations we’re faced with and what the health science tells us about what might lie ahead,” he said.
That has required health scientists, epidemiologists and other experts to mobilize and collaborate to understand and create sources of local data.
The Hawaii Pandemic Applied Modeling Work Group’s model is one example. It provides a 14-day forecast of cases, hospitalizations and deaths for Hawaii, calculated using various data points, such as demographic information, travel volume and hospital capacity.
But which is the most important data point for COVID-19? Case counts? Hospitalization rates? Test positivity rate? How does one decide what indicator weighs more than others, not just for models, but for making decisions in general?
“There’s a lot of nuances,” he said. “When it comes to the data, it’s not one or two data points that are most important for the state.”

Thomas Lee, an assistant professor of epidemiology with the UH Office of Public Health Studies, is also a modeler for the Hawaii Emergency Management Agency.
We should be looking at “all of them,” he said.
The Hawaii Department of Health announced it would release a long list of new data, including testing turnaround times and ventilator usage, which has yet to come.
The state health department’s promised list of new data to be released includes exponentially more than what was available before on the public dashboard. This new collection of information would “enable us to make better decisions,” Health Director Bruce Anderson said in an Aug. 5 news release.
“The accessibility of this information on a public dashboard allows us to clearly see how well we are dealing with this pandemic, helps others understand why decisions are made, and holds all of us to a higher standard,” Anderson said.
The department hasn’t said when these data are coming yet. It did not respond to Civil Beat’s inquiry Friday.
Hawaii Variable Q&A
Q. What is a seven-day moving average and how is it calculated?
A. A seven-day “moving” average means it’s a calculation of a series of averages of different subsets of a full dataset, not just a single set of values. If that sounds like gibberish, just remember that it’s more fluid than the average that you’re used to.
It’s often used by financial analysts and of course epidemiologists because it helps draw trends and looks at variability or fluctuation.
Q. What’s the difference between a leading and lagging indicator?
A. Not all indicators that tell something about the state of the pandemic are created equal. They can tell us different things about what’s happening and when something has happened or will happen.
“Leading indicators are forward-looking. They help us understand what lies ahead, whereas lagging indicators give us a sense of what’s happened,” Redding said.
See his slide:

If you’d like to read a whole post about it, check out Redding’s Hawaii Data Collaborative blog post on the topic.
Q. What is R naught? Rt? Explain some of these epidemiological terms that keep getting mentioned in the news.
A. Here’s a very helpful slide made by Thomas Lee to understand the basic definitions:

R naught is how many people you would infect “if you’re in a bubble,” while Rt considers some interventions, Lee said. For example, for Hawaii, travel volume, such as how many people fly in each day, would be an intervention metric to factor into an Rt equation.
“That’s the subtle, but very important difference,” he said.
Just in the past week, Hawaii’s surging Rt rate, or effective reproductive rate, raised alarm. But experts also warned of the metric’s flaws, such as how the equations vary across models.
Covid Act Now, Rt.live and COVID-19 Infections Tracker are some websites where Rt estimates can be tracked by state.
Q. What COVID-19 data is actually publicly available at the state level?
A. The State of Hawaii COVID-19 dashboard mainly features case counts by county, number of people released from isolation, total number of people that required hospitalization and the total number of deaths.
Here’s what the main page looked like as of Friday:

It also features an epidemic curve, which includes limited information about contact tracing — it shows how many of each day’s count is related to travel, travel-associated or community spread. The dashboard has testing data, too. It has the total number of tests performed and the test positivity rate.
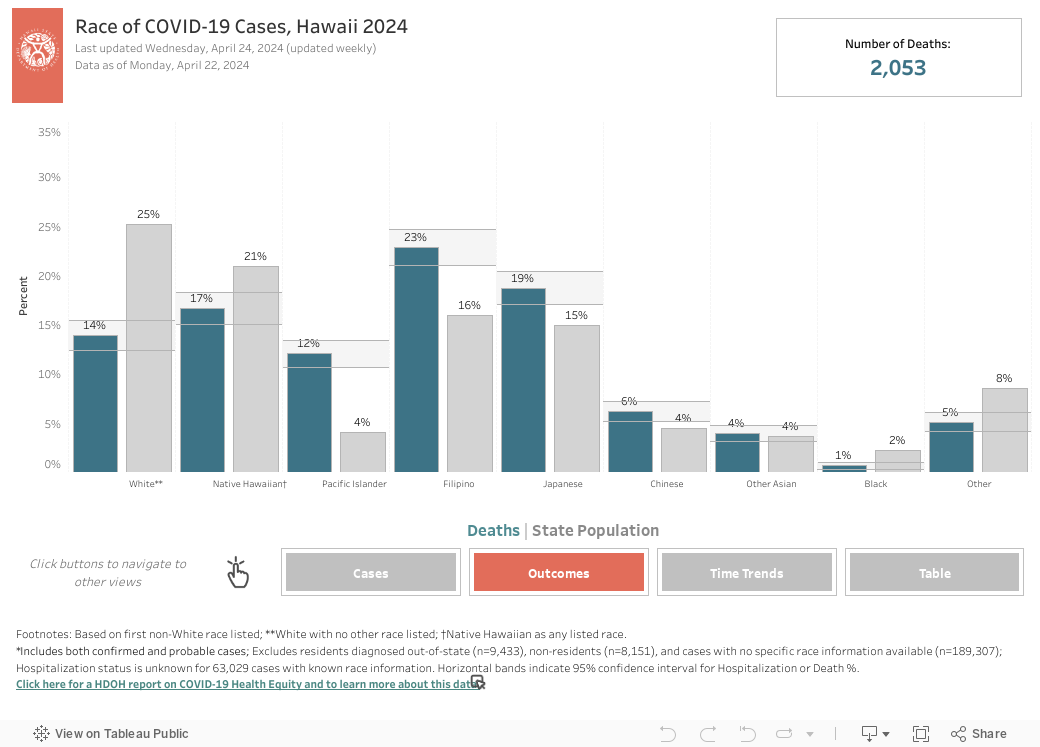
When it comes to breaking these data down, though, Hawaii’s dashboard is limited. Age breakdowns are available for cases, deaths and hospitalizations, but race breakdowns are far more limited — they’re only shown as percentages and the data is a week behind.
What’s not currently available on the dashboard but may selectively be announced:
- Clusters or cluster events at establishments or facilities
- Other contact tracing-related information and data
- Some hospitalization figures — Civil Beat health reporter Eleni Gill says sometimes the health department shares these figures with the press via its news releases
But as mentioned above, the health department has announced that it will release a lot more data. It’s just not certain when that will be.
Q. Is the military doing their own data checks and is it included with the state health department’s data? To what degree are data scientists concerned, or not, about not having full access to military case counts?
A. Here’s what Civil Beat’s military reporter Kevin Knodell said based on his reporting: “The military is maintaining data and shares it with the Department of Health. The Army Garrison Hawaii initially reported the numbers regularly with the public until the Pentagon ordered them to stop, but military officials still share numbers with state officials and they are tallied in the state’s total.
“The DOH however does not differentiate between military and civilian cases when it releases numbers in public releases. They are not particularly worried though and see the cases as not higher among local military.”
Q. Is there any data on how many positive non-residents are here in Hawaii?
A. The health department’s website actually says right on its latest update what percentage of the cases are residents. But that’s about it. As of Friday afternoon, it said 93% of the cases involved Hawaii residents.
In a previous interview, Hawaii State Epidemiologist Dr. Sarah Park said there’s a sentiment that non-residents are bringing in COVID-19 from elsewhere, but that’s not true. “We need to look in our own backyard,” she added.
Q. Where else can I get more information or data about COVID-19 in Hawaii?
A. Here are a few sources. If you know of more, please feel free to send an email:
- Aloha Trace crowdsources anonymous information from residents and provides near real-time data to research and public health organizations and government officials. Its Data Insights page features a map that shows hotspots where people may not be feeling well and could be showing symptoms of COVID-19.
- Hawaii Data Collaborative’s COVID-19 Tracker pulls data from multiple sources, including the state health department, and the U.S. Census Bureau. It’s recently added economic indicators to the page.
More questions? Submit them here:
 Sign up for our FREE morning newsletter and face each day more informed.
"here" - Google News
August 16, 2020 at 05:01PM
https://ift.tt/3kRkoBV
Trying To Make Sense Of COVID-19 Data? Here's Some Help - Honolulu Civil Beat
"here" - Google News
https://ift.tt/2z7PfXP
https://ift.tt/2Yv8ZPx


No comments:
Post a Comment