Over the years traders have been burned by perpetual precious metals bulls. There are times to be bullish on precious metals and times to stand aside. When inflation is increasing and the U.S. dollar is weakening it can be a time when precious metals can shine.
Let's take a look at Hecla Mining ( HL) , a miner of silver, gold and associated base metals. HL is my top pick for 2023 and maybe 2024.


In this daily bar chart of HL, below, I can see a small double bottom in July and September. Prices have rallied from late September into December. HL is trading the rising 50-day moving average line and above the still declining 200-day line. The On-Balance-Volume (OBV) line shows us an impressive rise from early September, telling me that buyers of HL are more aggressive than sellers. The Moving Average Convergence Divergence (MACD) oscillator is bullish.

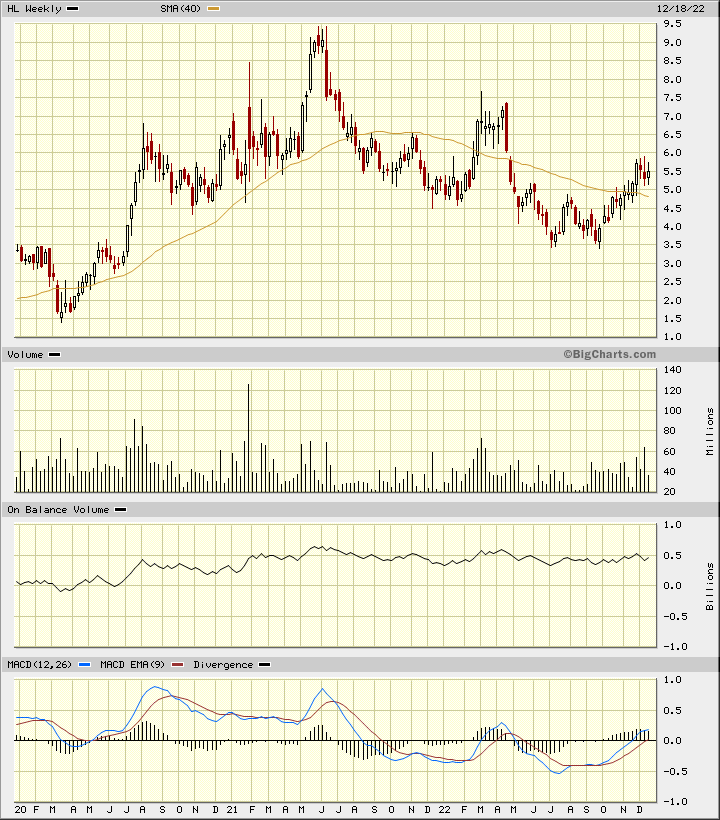
In this weekly Japanese candlestick chart of HL, below, I can see a bullish engulfing pattern in September to mark the end of the downtrend from 2021. Prices have rallied above the declining 40-week moving average line. The weekly OBV line shows a slight improvement from September. The MACD oscillator has just crossed above the zero line for an outright buy signal.

In this long-term close-only chart of HL, below, we can see the price action back to 1985. Notice the huge base pattern from 1995 as prices trade sideways between $12 and roughly $2. A weekly close above $9 could start a major move to the upside. The weekly OBV line has been strong since 2019. A strong close above $12 will launch HL into a breakout from a 27-year base pattern. My teacher at the New York Institute of Finance in 1976, Alan Shaw CMT, used to say "The bigger the base, the higher in space." We'll see.

In this daily Point and Figure chart of HL, below, I used daily close-only price data. Here the chart suggests a price target of $8.75.

In this second Point and Figure chart of HL, below, I used weekly price data with a five- box reversal filter. Here this chart suggests a target of $12.75. Point and Figure charts do not include time, so we have no clear idea of the timing of this price target. Could it be reached in 2023? 2024? We'll see.

Bottom line strategy: Traders and investors will need to be patient with this recommendation. Prices could move sideways in the $5.00 to $6.00 range for several weeks or even months before another push higher. Traders could probe the long side of HL around $5, risking to $4.25.
"like this" - Google News
December 27, 2022 at 10:00PM
https://ift.tt/nmP4wsd
I Sure as Heck Like This Miner as My Top Pick for 2023, and Maybe ... - RealMoney
"like this" - Google News
https://ift.tt/tumbgvs
Shoes Man Tutorial
Pos News Update
Meme Update
Korean Entertainment News
Japan News Update
No comments:
Post a Comment